Details
-
Bug
-
Status: Resolved
-
 Major
Major
-
Resolution: Incomplete
-
2.1.1, 2.1.2
-
None
Description
[Abstract]
I recently encountered an OOM error in a simple groupByKey application. After profiling the application, I found the OOM error is related to the shuffle spill and records (de)serialization. After analyzing the OOM heap dump, I found the root causes are (1) memory leak in ExternalAppendOnlyMap, (2) large static serializer batch size (spark.shuffle.spill.batchSize =10000) defined in ExternalAppendOnlyMap, and (3) memory leak in the deserializer. Since almost all the Spark applications rely on ExternalAppendOnlyMap to perform shuffle and reduce, this is a critical bug/defect. In the following sections, I will detail the testing application, data, environment, failure symptoms, diagnosing procedure, identified root causes, and potential solutions.
[Application]
This is a simple GroupBy application as follows.
table.map(row => (row.sourceIP[1,7], row)).groupByKey().saveAsTextFile()
The sourceIP (an IP address like 127.100.101.102) is a column of the UserVisits table. This application has the same logic as the aggregation query in Berkeley SQL benchmark (https://amplab.cs.berkeley.edu/benchmark/) as follows.
  SELECT * FROM UserVisits
  GROUP BY SUBSTR(sourceIP, 1, 7);
The application code is available at [1].
[Data]
The UserVisits table size is 16GB (9 columns, 132,000,000 rows) with uniform distribution. The HDFS block size is 128MB. The data generator is available at [2].
[Environment]
Spark 2.1 (Spark 2.2 may also have this error), Oracle Java Hotspot 1.8.0, 1 master and 8 workers as follows.
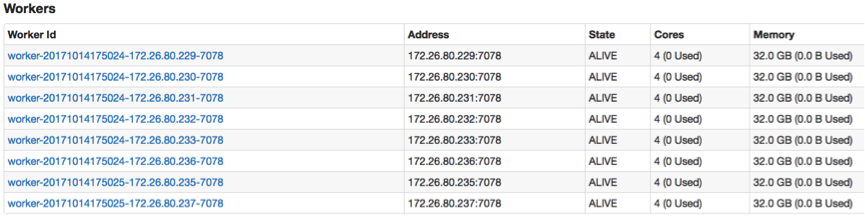
This application launched 32 executors. Each executor has 1 core and 7GB memory. The detailed application configuration is
   total-executor-cores = 32
   executor-cores = 1
   executor-memory = 7G
   spark.default.parallelism=32
   spark.serializer = JavaSerializer (KryoSerializer also has OOM error)
[Failure symptoms]
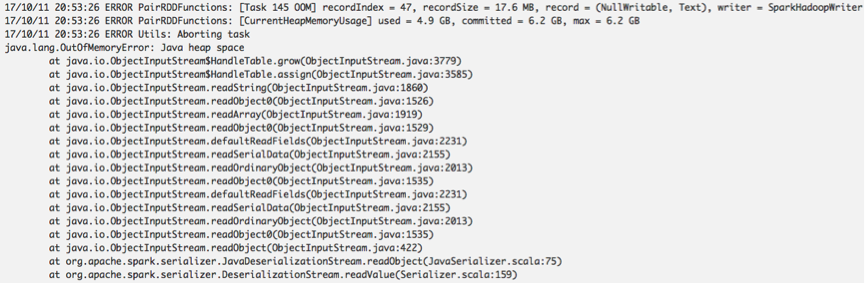
This application has a map stage and a reduce stage. An OOM error occurs in a reduce task (Task-17) as follows.
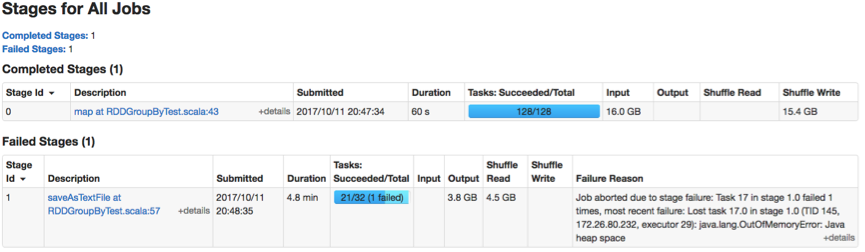
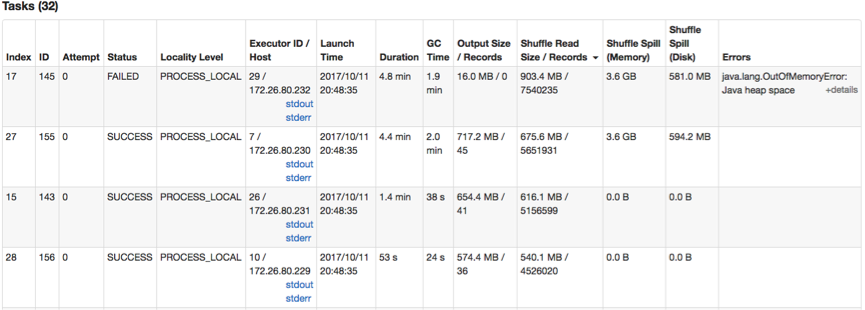
Task-17 generated an OOM error. It shuffled ~1GB data and spilled 3.6GB data onto the disk.
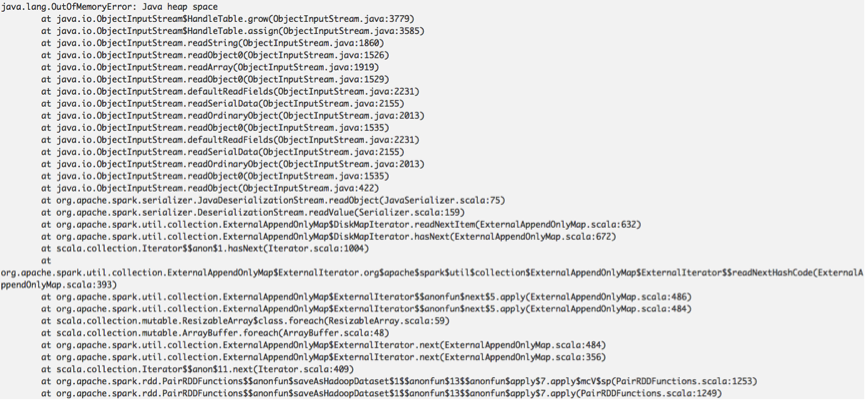
Task-17 log below shows that this task is reading the next record by invoking ExternalAppendOnlyMap.hasNext(). From the OOM stack traces and the above shuffle metrics, we cannot identify the OOM root causes.
A question is that why Task-17 still suffered OOM errors even after spilling large in-memory data onto the disk.
[Diagnosing procedure]
Since each executor has 1 core and 7GB, it runs only one task at a time and the task memory usage is going to exceed 7GB.
1: Identify the error phase
I added some debug logs in Spark, and found that the error phase is not the spill phase but the memory-disk-merge phase.
The memory-disk-merge phase: Spark reads back the spilled records (as shown in ① Figure 1), merges the spilled records with the in-memory records (as shown in ②), generates new records, and output the new records onto HDFS (as shown in ③).
2. Dataflow and memory usage analysis
I added some profiling code and obtained dataflow and memory usage metrics as follows. Ki represents the i-th key, Ri represents the i-th row in the table.
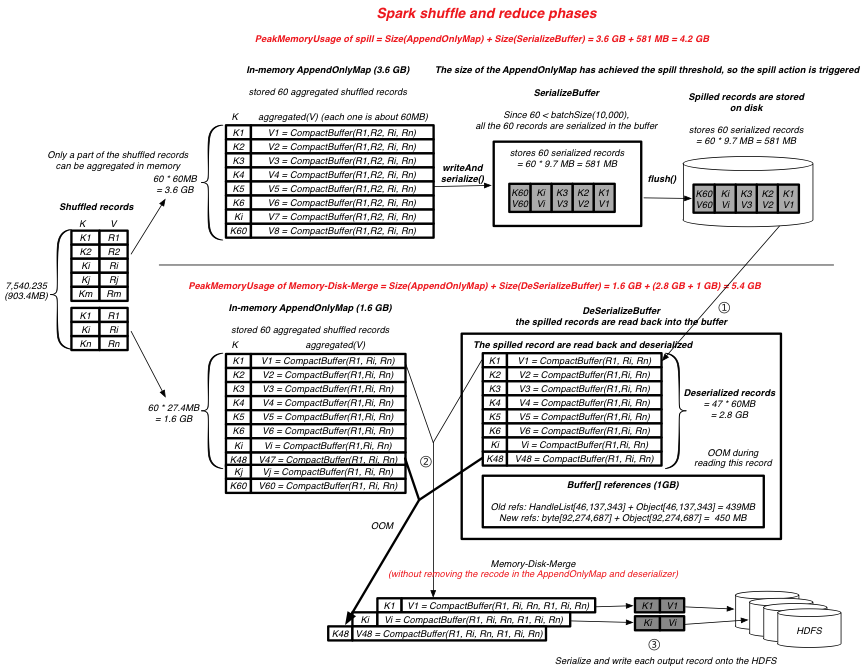
Figure 1: Dataflow and Memory Usage Analysis (see https://github.com/JerryLead/Misc/blob/master/SparkPRFigures/OOM/SPARK-22286-OOM.pdf for the high-definition version)
The concrete phases with metrics are as follows.
[Shuffle read] records = 7,540,235, bytes = 903 MB
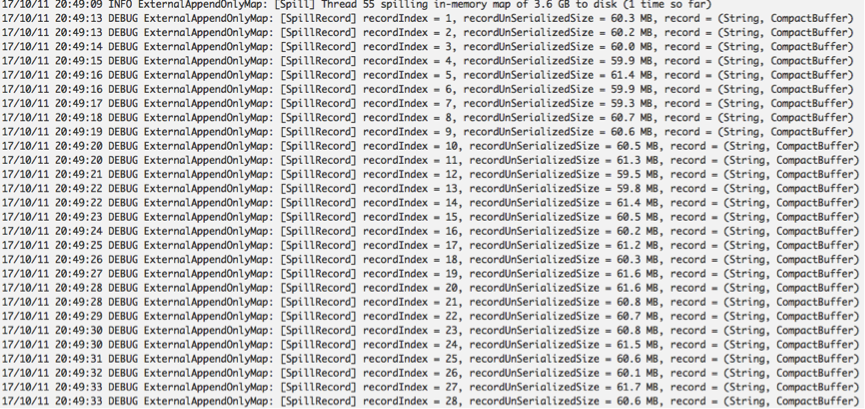
[In-memory store] As shown in the following log, about 5,243,424 of the 7,540,235 records are aggregated to 60 <k, list(v)> records in AppendOnlyMap. Each <k, list(v)> record is about 60MB. There are only 60 distinct keys in the shuffled records.

[Spill] Since 3.6 GB has achieved the spill threshold, Spark spills the 60 records onto the disk. Since 60 < serializerBatchSize (default 10,000), all the 60 records are serialized into the SerializeBuffer and then written onto the disk as a file segment. The 60 serialized records are about 581 MB (this is an estimated size, while the real size maybe larger).

[In-memory store] After spilling, Spark released the old AppendOnlyMap (3.6GB) and allocated a new AppendOnlyMap. Then, Spark aggregated the rest 2,296,811 shuffled records into AppendOnlyMap. After aggregation, AppendOnlyMap has 60 records, and each record is about 27 MB. The AppendOnlyMap is about 1.6 GB (shown as currentMap in the heap dump).
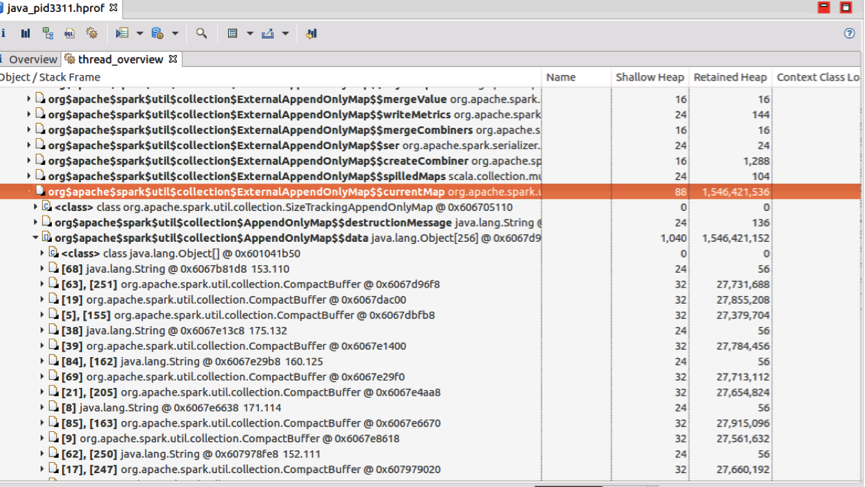
Figure 2 AppendOnlyMap in the heap dump
[Memory-Disk-Merge] The next step is to merge the on-disk spilled records (60 records, unserilaizedSize=3.6GB, serializedSize=581MB) with the in-memory records in AppendOnlyMap (60 records/1.6 GB). As shown in Figure 1, for each spilled record Rec_i, Spark uses Java/Kryo deserializer to deserialize Rec_i into the DeSerializeBuffer, merges Rec_i with the in-memory record with the same key, generates new record, and finally outputs the new record onto HDFS. This procedure is assumed to be pipelined with low memory consumption (without any accumulation of records and intermediate results). However, the task generated an OOM error in this procedure (while merging the 48-th spilled record with the 48-th record in AppendOnlyMap). The following log in PairRDDFunctions. saveAsNewAPIHadoopDataset() shows this fact.
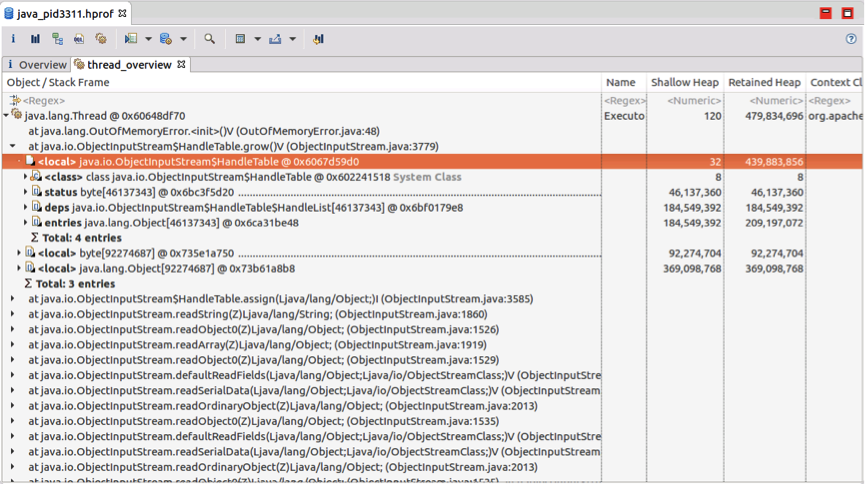
Then, I dump the OOM heap. The heap dump below shows that the memory consumption mainly consists of three parts:
(1) AppendOnlyMap (1.6GB, 60 records, avgRecordSize = 27.4MB) (Figure 2)
(2) Spilled records buffed in DeSerializeBuffer (about 3GB)
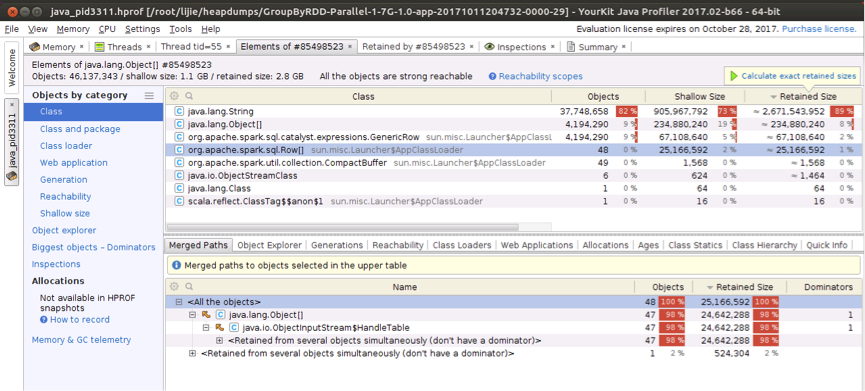
The above figures shows that 48 spilled records are buffered in DeSerializeBuffer (HandleTable) with about 2.6GB String and 300MB other objects.
(3) Object[] references in DeSerializeBuffer (~1GB), including HandleTable references (status+deps+entries, 439MB), growed object[] references due to data structure expansion (byte[92274687] + Object[92274687], 450MB).
The left space 7GB - (1.6GB + 3GB + 1GB) = 1.4 GB has been used for other objects and JVM GC swap space.
[Identified root causes]
The above analysis reveals the root cause: the spilled records and in-memory records are still kept in memory even they have been merged. The root causes can be further summarized as follows.
(1) Memory leak in ExternalyAppendOnlyMap: The merged in-memory records in AppendOnlyMap are not cleared after Memory-Disk-Merge.
(2) Large serializer batch size:
The serializerBatchSize ("spark.shuffle.spill.batchSize", 10000) is too arbitrary and too large for the application that have small aggregated record number but large record size. For these applications, all the spilled records (3.6GB in this case) will be serialized in a buffer and written as a whole file segment at a time. In other words, the 3.6GB records will be read back to memory at a time. Other applications that have large record number with small record size may be OK, because the spilled records may be serialized and written to many files. In other words, the 3.6GB records will be read back to memory in several times with low memory consumption.
(3) Memory leak in deserializer: The spilled records are not cleared from the DeSerializeBuffer after Memory-Disk-Merge, which leads to both large buffer and large object references.
[Potential solutions]
For each root cause, we can
(1) Handle memory leak in ExternalyAppendOnlyMap: Remove the records in both in AppendOnlyMap and read-back-spilledMap once the in-memory records have been merged. Current AppendOnlyMap (the following currentMap) does not delete the merged records until all of the records in it have been merged.
private val sortedMap = CompletionIterator[(K, C), Iterator[(K, C)]](destructiveIterator(
      currentMap.destructiveSortedIterator(keyComparator)), freeCurrentMap()))
(2) Adaptive serializer batch size instead of static spill threshold and static serializerBatchSize: Since we can dynamically obtain (estimate) the record number and bytes in AppendOnlyMap, we can estimate the size of serialize/deserialize buffer size when the spill threshold is achieved. Based on this information, we can accordingly lower the batch size to write the serialized records into multiple file segments.
(3) Handle memory leak in the deserializer: Try to remove the merged spilled records in the deserializer or design a new deserializer.
The whole task OOM log can is available at [3].
[References]
[1] The GroupBy application code. https://github.com/JerryLead/SparkGC/blob/master/src/main/scala/applications/sql/rdd/RDDGroupByTest.scala
[2] Data generator. https://github.com/JerryLead/SparkGC/tree/master/datagen/sql/htmlgen
[3] Task-17 stderr log. https://github.com/JerryLead/Misc/blob/master/SparkPRFigures/OOM/Task-17-log.txt